Trace Quantity Measurement System - Aplicaciones

La mayoría de los documentos sobre la LITERATURA están disponibles en formato PDF. Necesitará Adobe Acrobat Reader para abrir y leer documentos PDF. Si aún no tiene Acrobat Reader, puede descargarlo gratis en el sitio web de Adobe. Haga clic en el icono OBTENER ADOBE READER de la izquierda para descargar una copia gratuita de Adobe Acrobat Reader.
Sample Analysis
Quantitation of Trace Quantities of Nucleic Acids
Samples of nucleic acids and proteins are often only available in small quantities. Accordingly, cells capable of trace quantity measurements are required. In this example, trace quantity measurements of nucleic acids were performed using a TrayCell™ with an optical path length of 1.0 mm, which allows measurements with sample volumes of 3 to 5 μL.
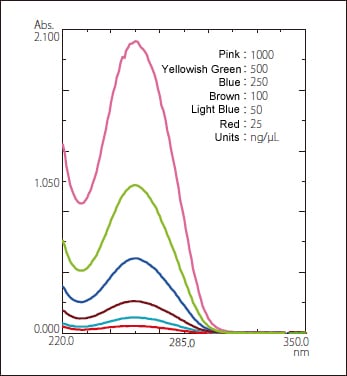
Lambda-DNA, a type of double stranded DNA often utilized in nucleic acid analysis, was analyzed.
A 1.0 Abs concentration sample was measured repeatedly 10 times with good precision, as follows:
The standard deviation was 0.014629 with a CV of 1.34 %.
The calibration curve formula was Y = 0.00201x + 0.00827, and the correlation coefficient was r2 = 0.99989.
Overlaid Spectra for Nucleic Acids with Different Concentrations